
Tekmatix Help Articles
Love your help
Use the search bar below to find help guides and articles for using Tekmatix
Use the search bar below to look for help articles you need.

How To Customize Your Dashboard with Widgets in Tekmatix
How To Customize Your Dashboard with Widgets in Tekmatix
A well-organized dashboard can give your business a clear edge. Whether you need to track sales performance, lead conversions, or campaign activity, custom dashboard widgets in Tekmatix help you visualize what matters most—at a glance.
In this guide, we’ll walk you through the step-by-step process of creating and customizing widgets, including a real-world example to show how you can apply this in your business.
Why This Feature Matters
Your dashboard is your command center. Tekmatix’s dashboard widgets let you:
Track critical KPIs in real time
Visualize data with charts and tables
Build dashboards for individual users or full teams
Filter and group data for deeper insights
This makes it easier to manage performance and make decisions without having to run multiple reports.
Step-by-Step: How to Add Widgets to Your Tekmatix Dashboard
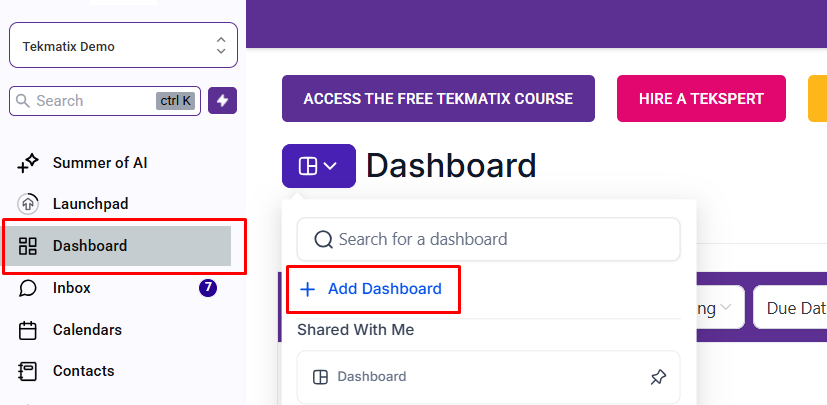
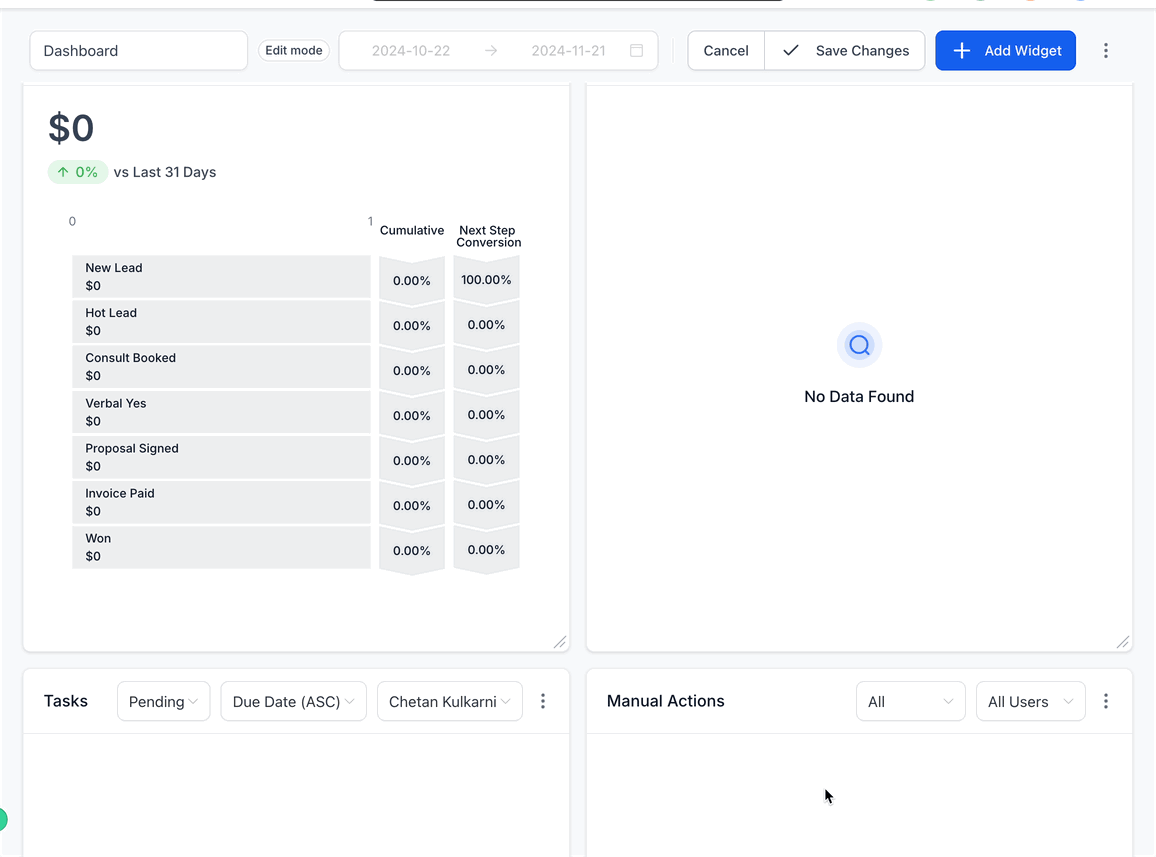
Step 1: Go to the Dashboard Tab
Log in to Tekmatix and select the Dashboard tab from the left-hand menu. This opens your default sub-account dashboard.
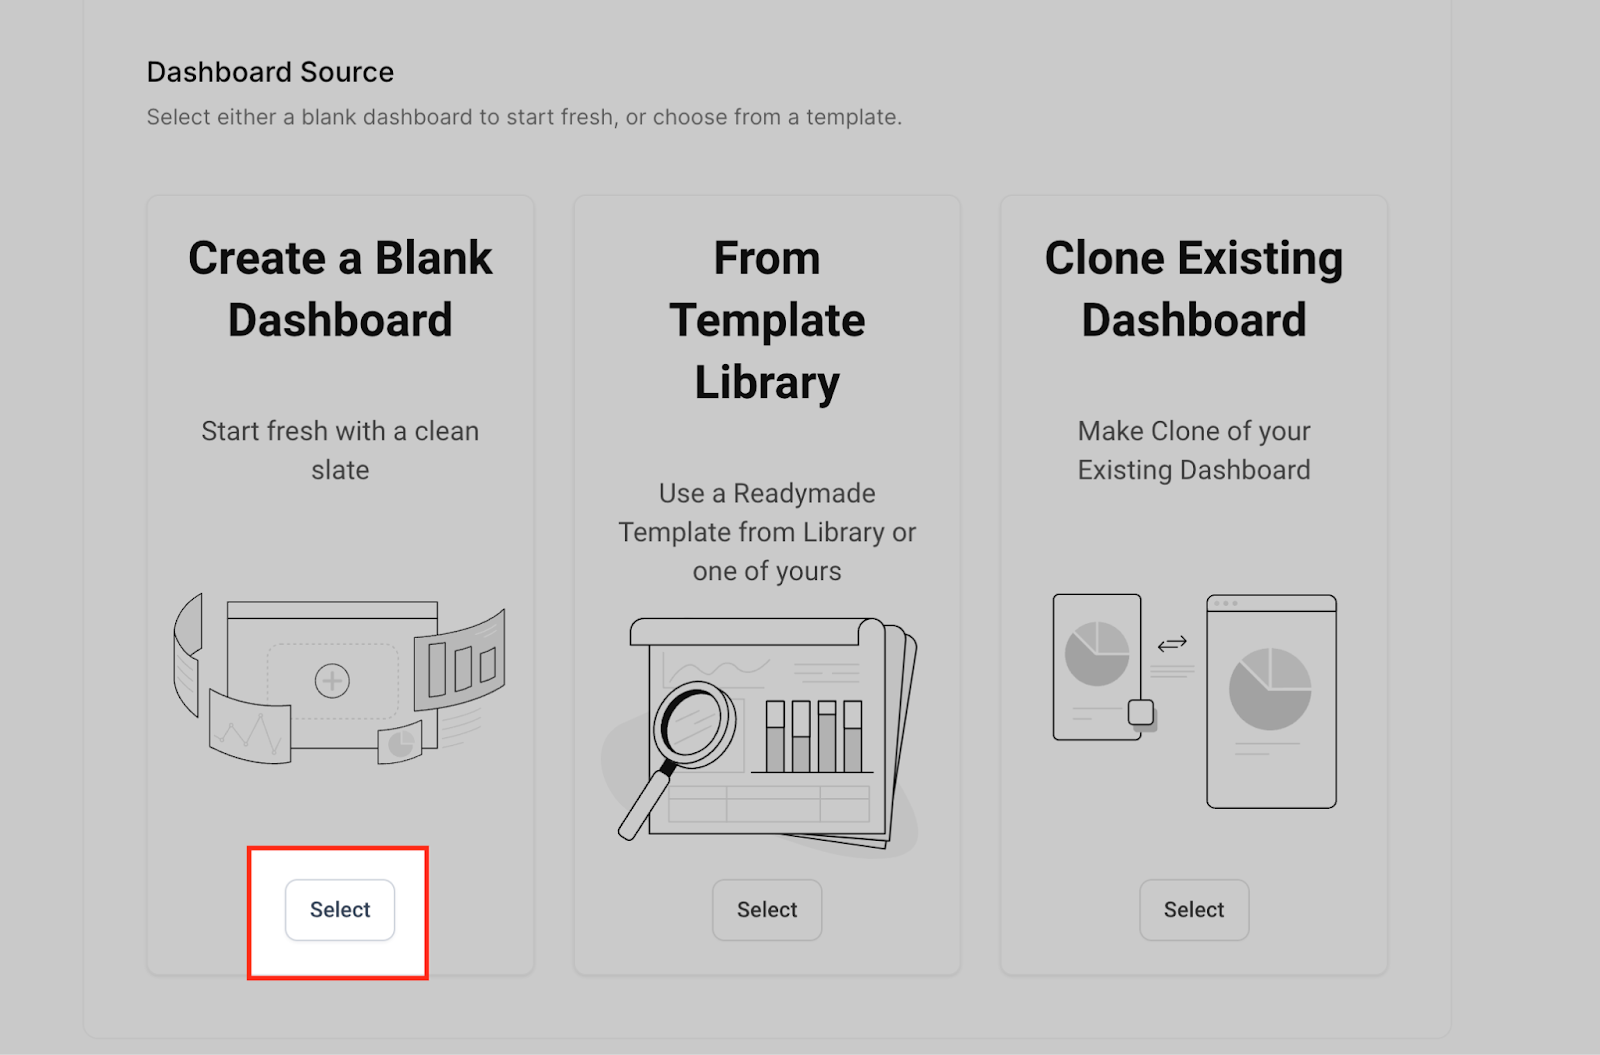
Step 2: (Optional) Create a New Dashboard
Want to keep things separate? Click Add Dashboard > Select a Blank Dashboard
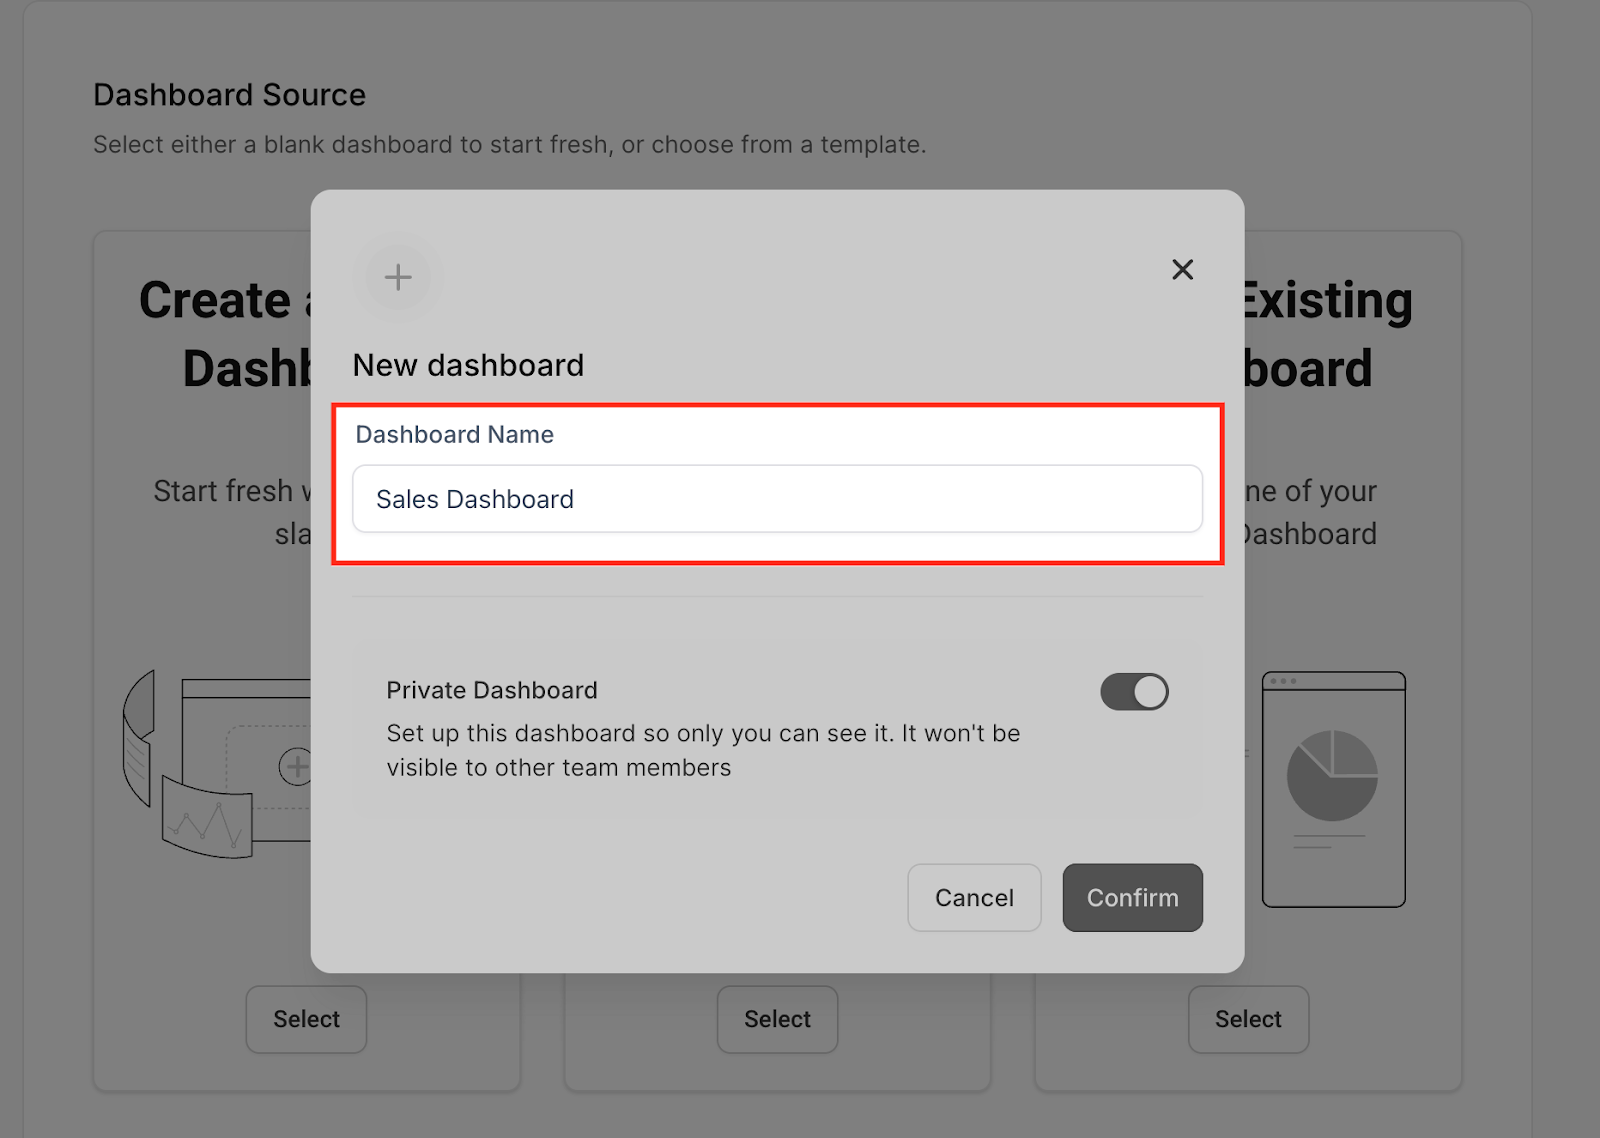
Name it (e.g., Marketing Dashboard)
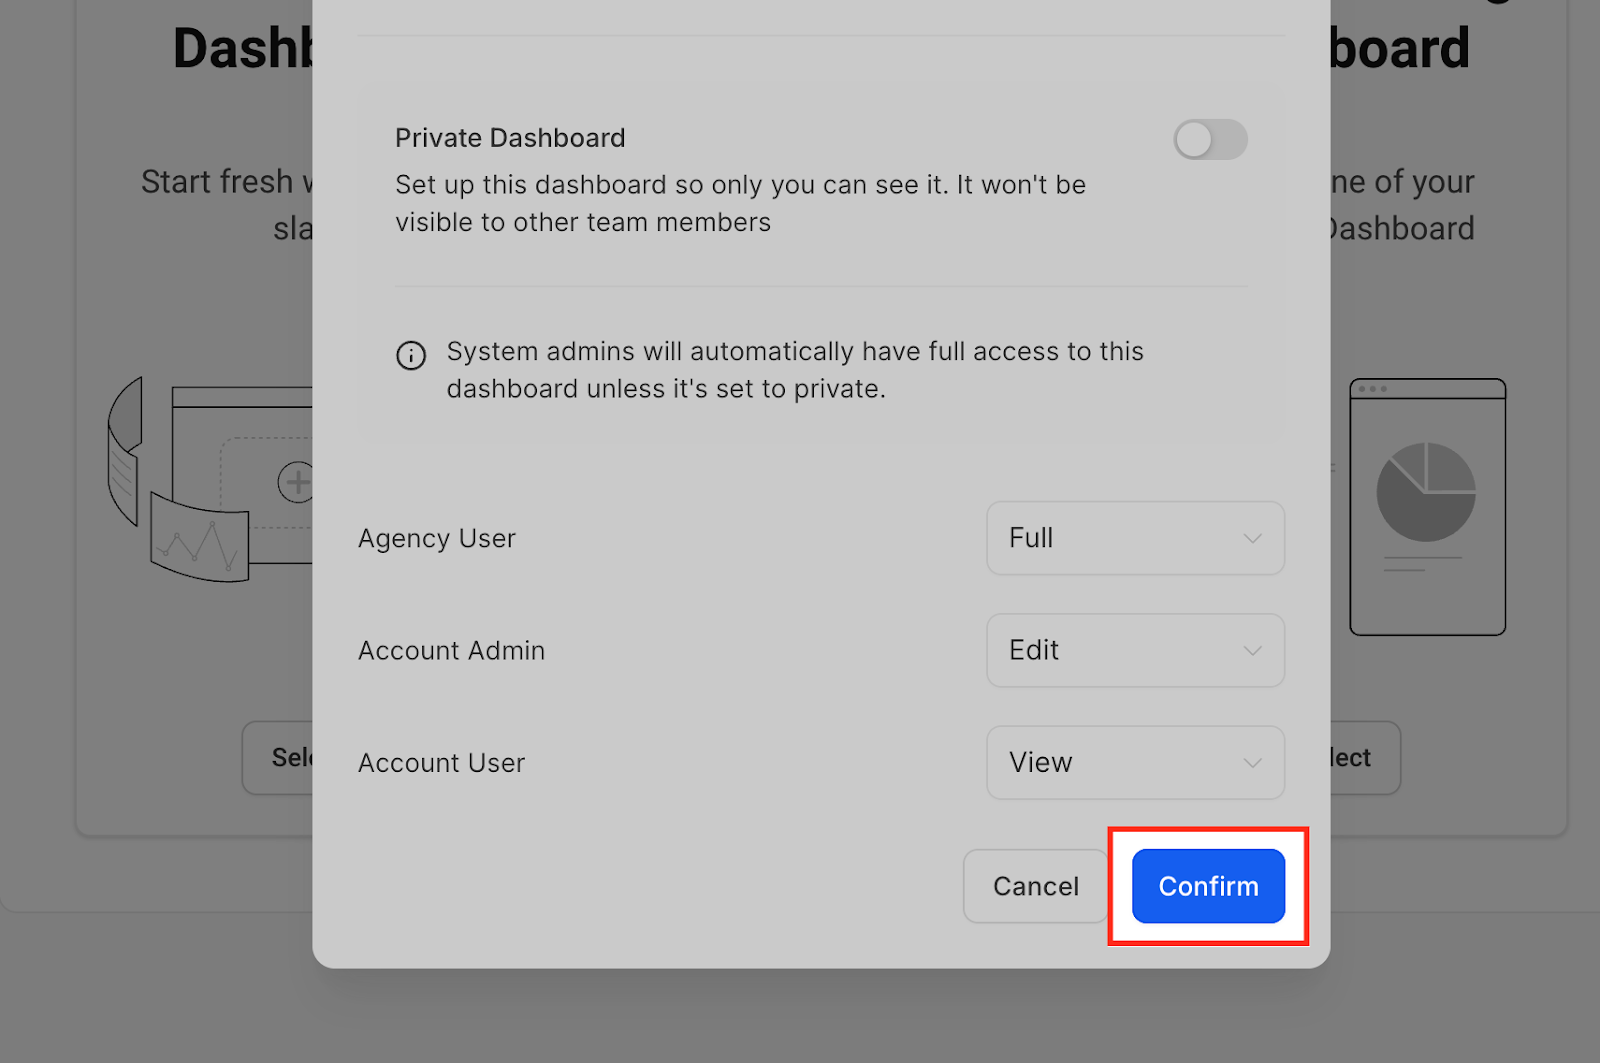
Set visibility:
Private: only you can see it
For Everyone: shared with your team
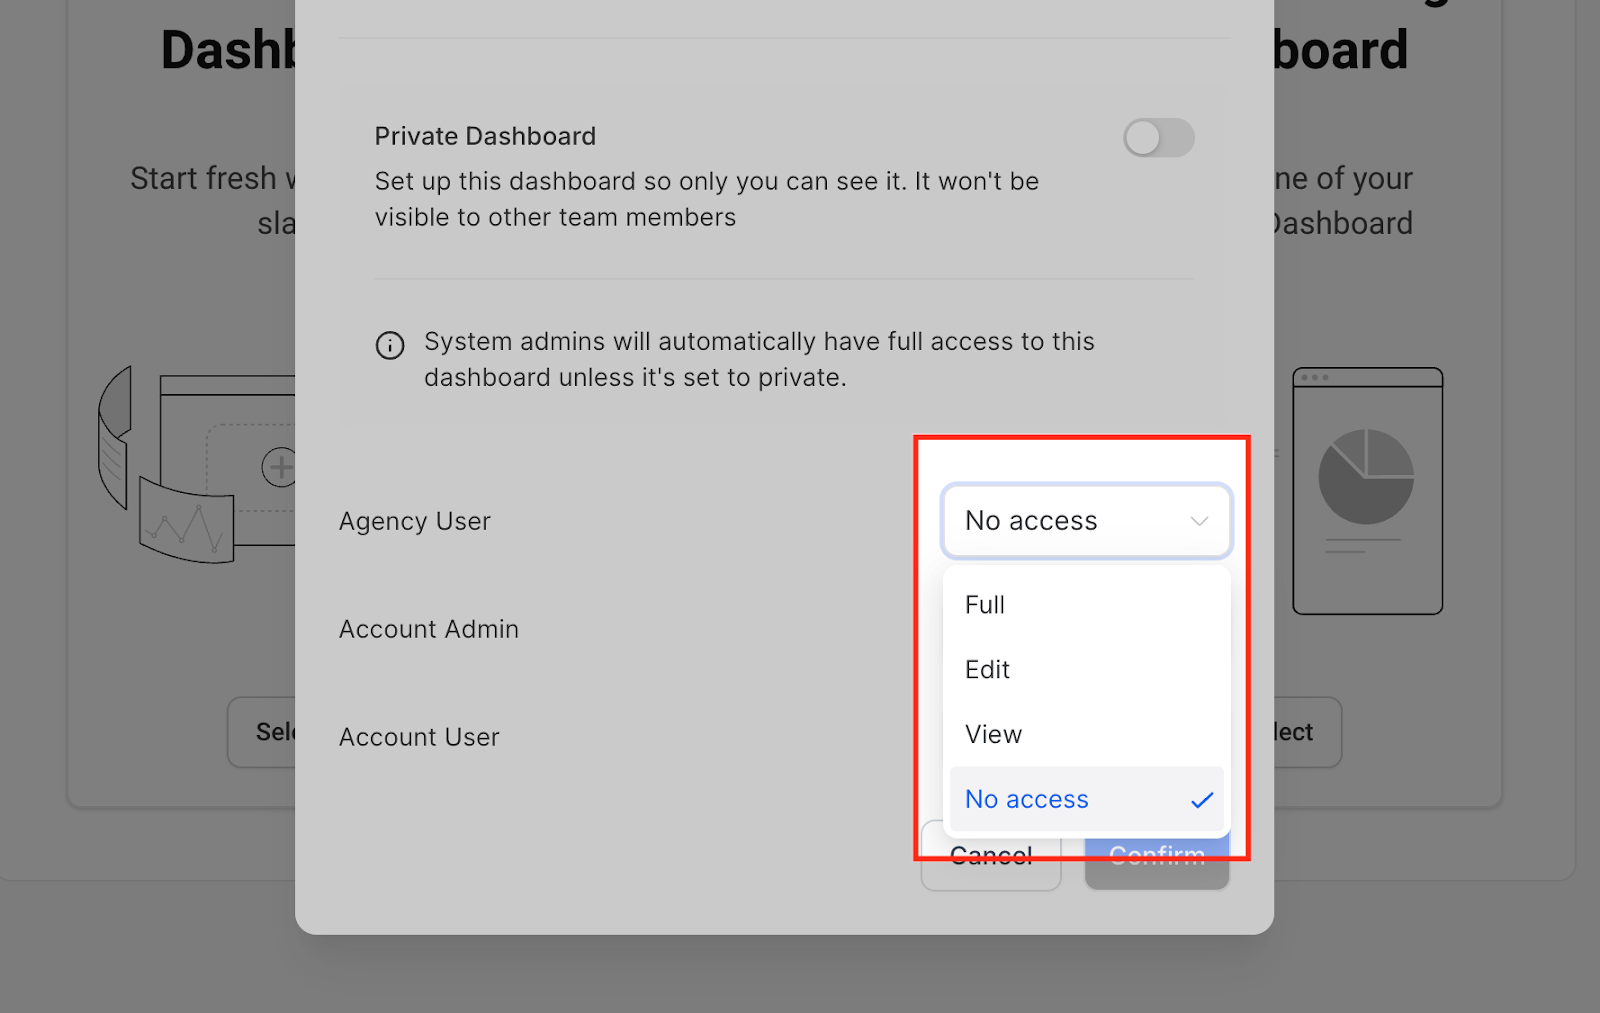
Assign permission levels (View/Edit/Full/None) to users
Click Confirm to create your new blank dashboard.

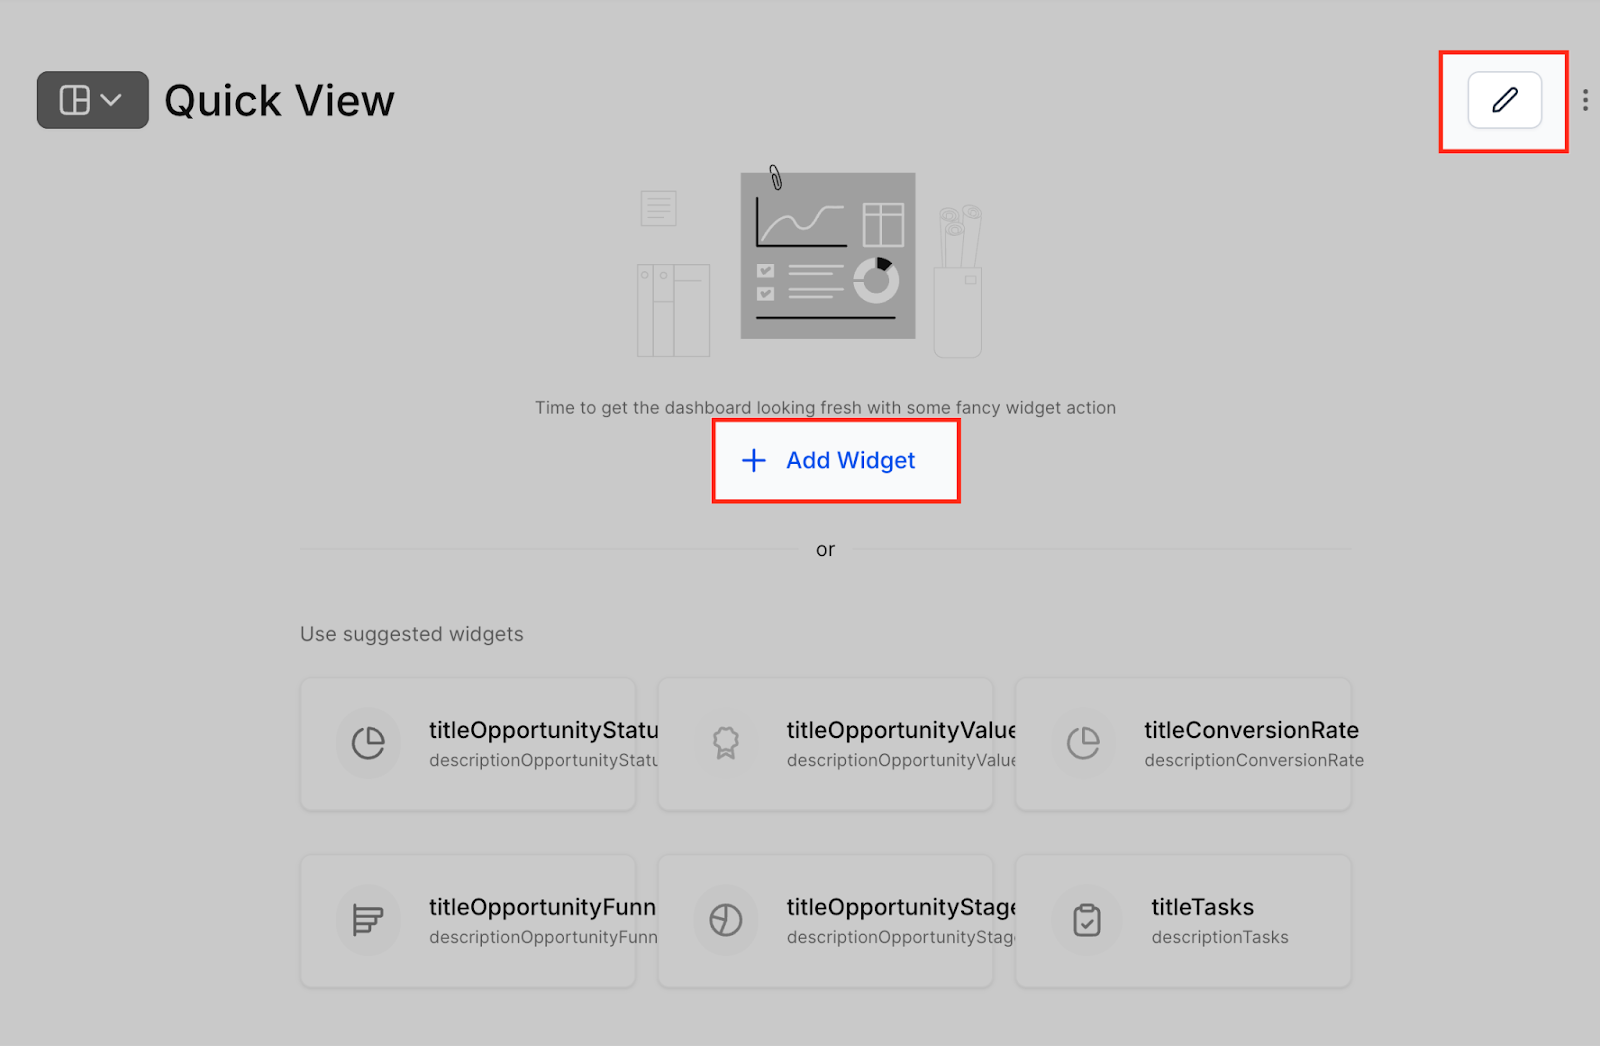
Step 3: Open the Widget Menu
Click Add Widget (or the pencil icon in the upper-right corner if editing an existing dashboard). This opens the widget selection panel.
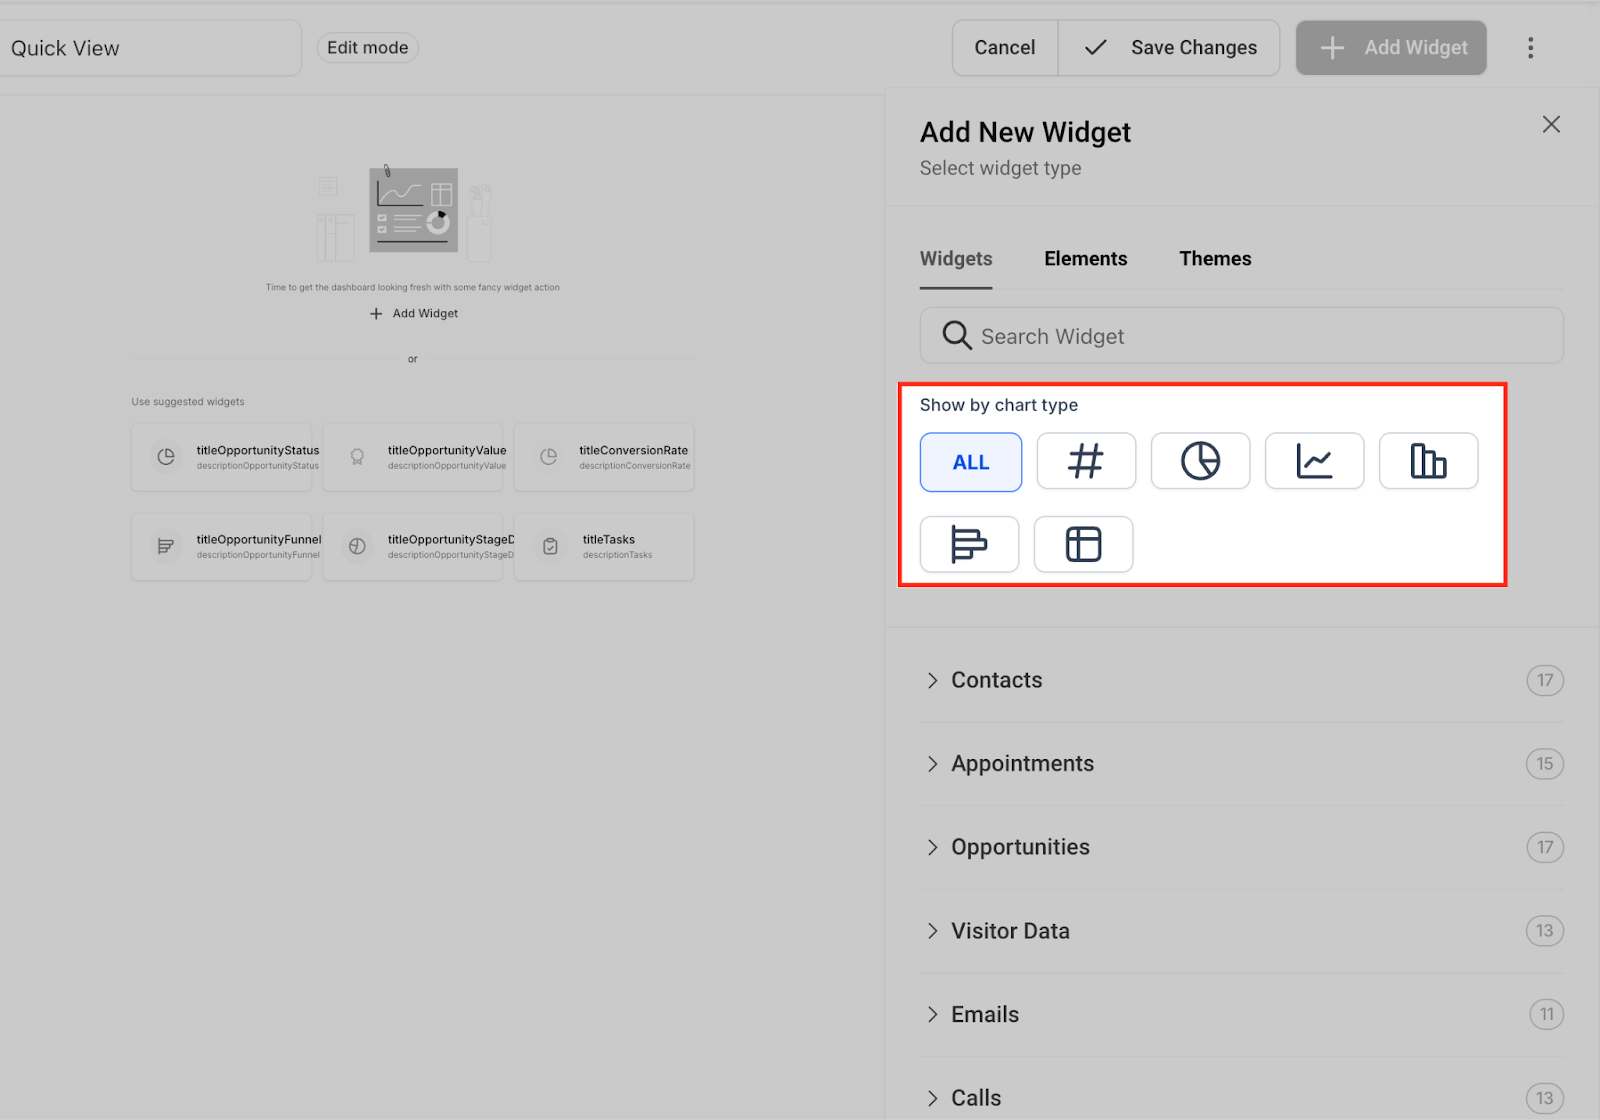
Step 4: Choose Your Widget
Select a Chart Type:
Numeric
Donut
Line
Bar / Horizontal Bar
Table
Choose Widget Category:
Select based on what you want to track (e.g., Appointments, Opportunities, Payments).
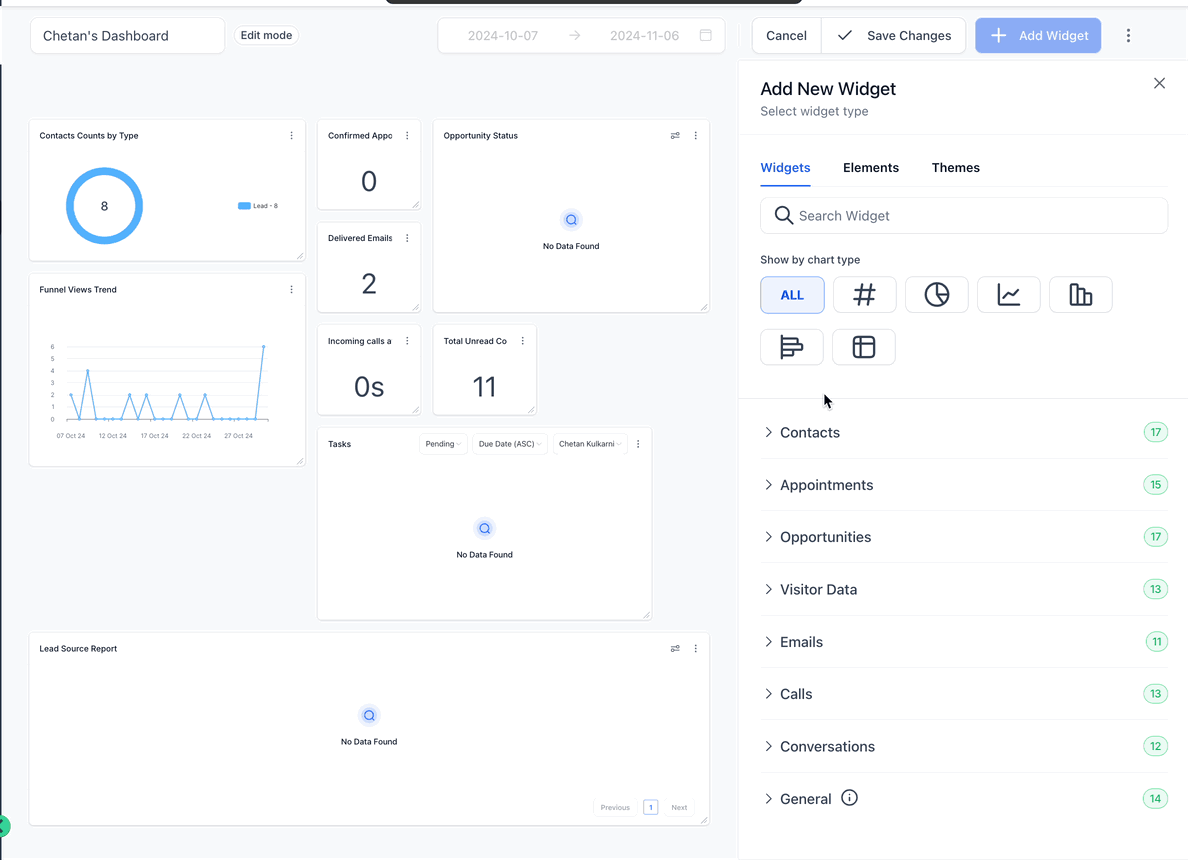
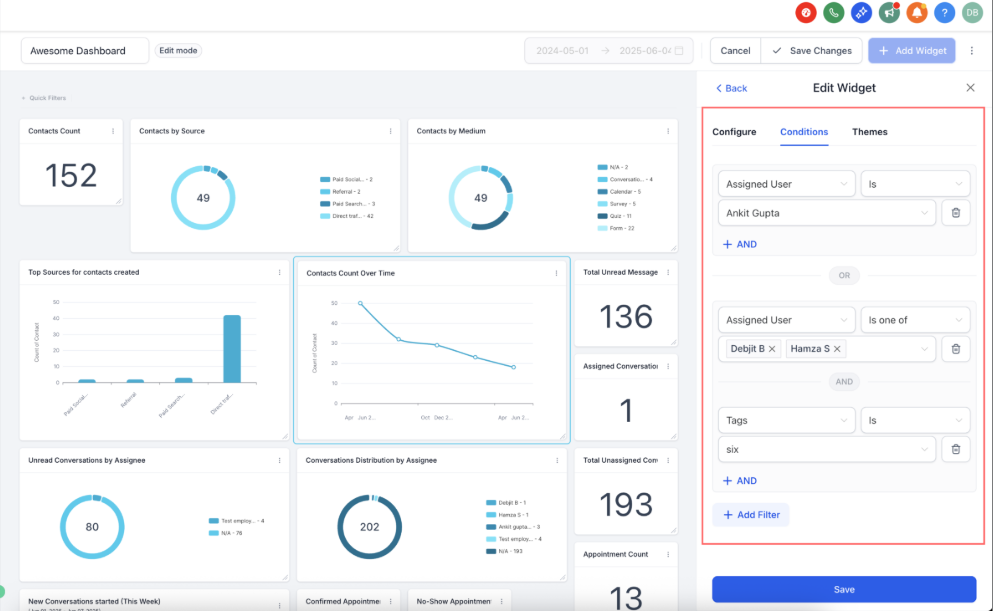
Step 5: Customize Your Widget
Within the Widget Settings:
Add a Title and optional Description
Choose how your data should be displayed
Configure filters using Conditions
Pro Tip: Use logical groups:
AND = All conditions must be true
OR = At least one condition must be true
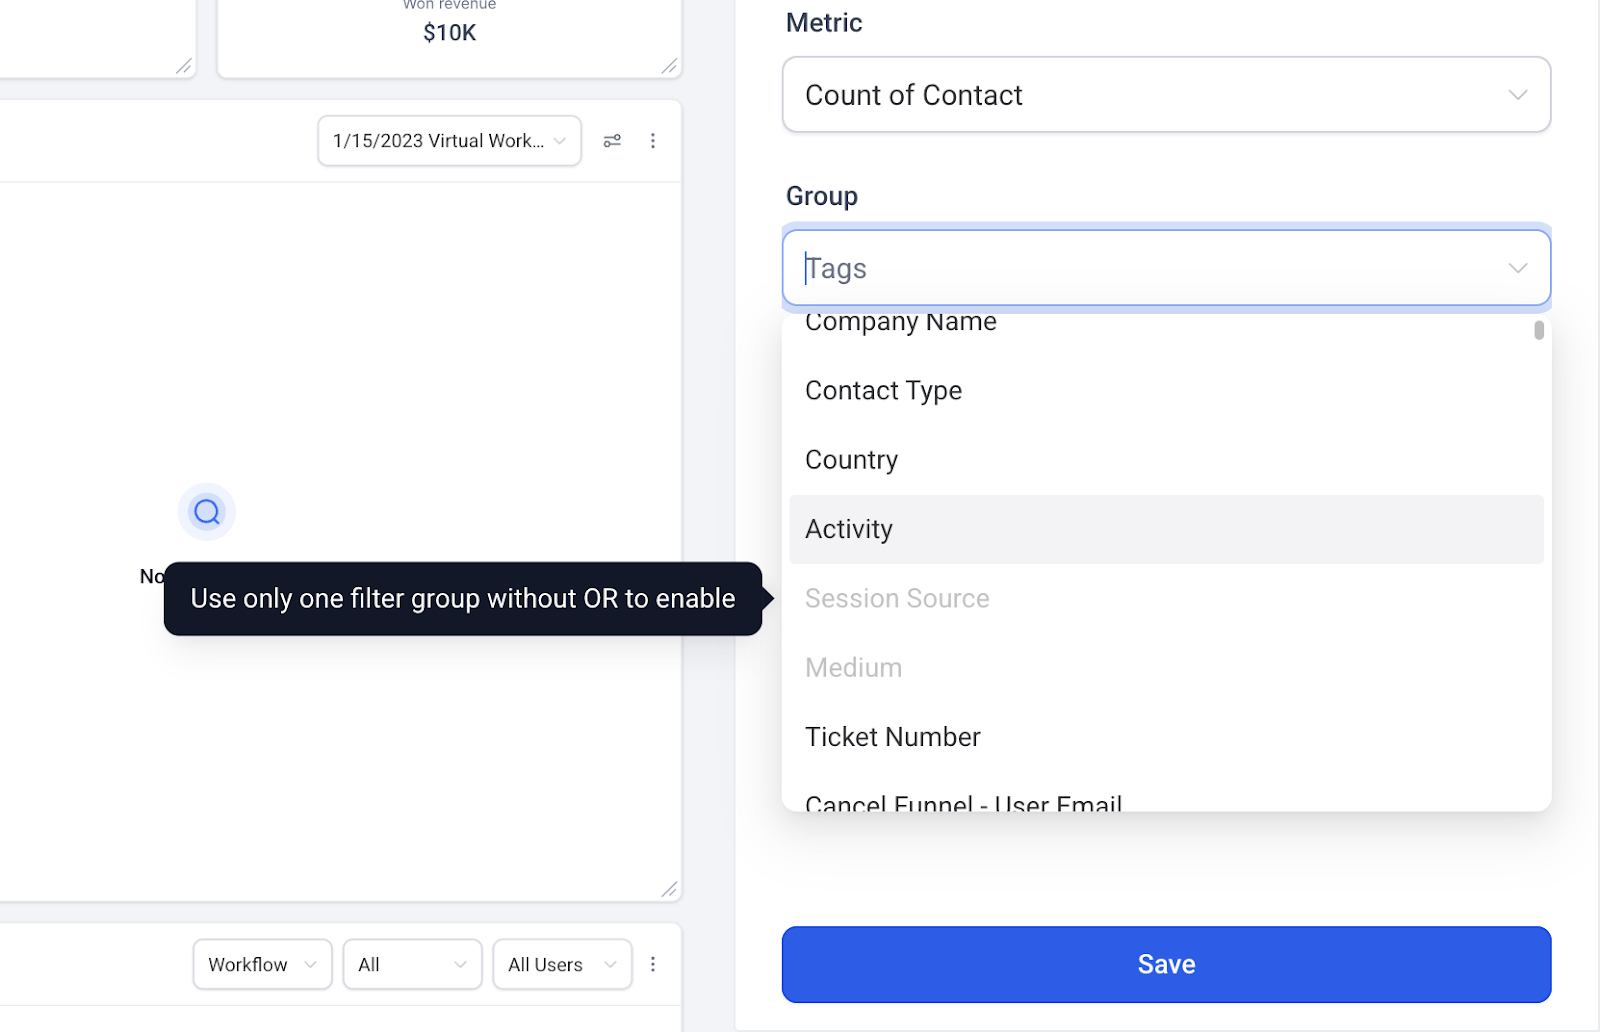
Note on Attribution Fields:
If you're using "Session Source" or "Session Medium":
Only 1 filter group is allowed
You must include either First Touch or Last Touch as a filter

Step 6: Save Your Widget
Once customized, click Save. Your widget will now appear on the dashboard.
Step 7: Add More Widgets
Repeat the steps to create more widgets and build a well-rounded view of your performance.
Step 8: Organize Your Layout
Drag and drop widgets where you want them. Resize each widget to highlight what’s important.
Step 9: Save Dashboard Changes
Click Save Changes at the top of your dashboard to lock in your setup.
Sample Use Case: Sales Manager's Dashboard
Scenario: Sarah, a Sales Manager, wants a dashboard to track her team’s performance.
She creates a new dashboard titled “Sales Overview” with the following widgets:
Bar Chart showing new opportunities created this week
Numeric Widget showing total closed deals this month
Donut Chart breaking down deal stages (Proposal Sent, Negotiation, Won)
Line Chart tracking revenue trends over the past 30 days
With filters applied to show only deals assigned to her team, Sarah now has a real-time dashboard that helps her make decisions fast—without digging into reports.
Best Practices
Keep dashboards clean and focused
Use filters to narrow results to what matters most
Regularly review and adjust widgets as your strategy evolves
Wrapping Up
Using custom widgets in Tekmatix puts essential business insights right at your fingertips. Whether you manage sales, marketing, or operations, a well-built dashboard keeps your team focused and informed.

Latest Blog Posts
How To Customize Your Dashboard with Widgets in Tekmatix
How To Customize Your Dashboard with Widgets in Tekmatix
A well-organized dashboard can give your business a clear edge. Whether you need to track sales performance, lead conversions, or campaign activity, custom dashboard widgets in Tekmatix help you visualize what matters most—at a glance.
In this guide, we’ll walk you through the step-by-step process of creating and customizing widgets, including a real-world example to show how you can apply this in your business.
Why This Feature Matters
Your dashboard is your command center. Tekmatix’s dashboard widgets let you:
Track critical KPIs in real time
Visualize data with charts and tables
Build dashboards for individual users or full teams
Filter and group data for deeper insights
This makes it easier to manage performance and make decisions without having to run multiple reports.
Step-by-Step: How to Add Widgets to Your Tekmatix Dashboard
Step 1: Go to the Dashboard Tab
Log in to Tekmatix and select the Dashboard tab from the left-hand menu. This opens your default sub-account dashboard.
Step 2: (Optional) Create a New Dashboard
Want to keep things separate? Click Add Dashboard > Select a Blank Dashboard
Name it (e.g., Marketing Dashboard)
Set visibility:
Private: only you can see it
For Everyone: shared with your team
Assign permission levels (View/Edit/Full/None) to users
Click Confirm to create your new blank dashboard.
Step 3: Open the Widget Menu
Click Add Widget (or the pencil icon in the upper-right corner if editing an existing dashboard). This opens the widget selection panel.
Step 4: Choose Your Widget
Select a Chart Type:
Numeric
Donut
Line
Bar / Horizontal Bar
Table
Choose Widget Category:
Select based on what you want to track (e.g., Appointments, Opportunities, Payments).
Step 5: Customize Your Widget
Within the Widget Settings:
Add a Title and optional Description
Choose how your data should be displayed
Configure filters using Conditions
Pro Tip: Use logical groups:
AND = All conditions must be true
OR = At least one condition must be true
Note on Attribution Fields:
If you're using "Session Source" or "Session Medium":
Only 1 filter group is allowed
You must include either First Touch or Last Touch as a filter
Step 6: Save Your Widget
Once customized, click Save. Your widget will now appear on the dashboard.
Step 7: Add More Widgets
Repeat the steps to create more widgets and build a well-rounded view of your performance.
Step 8: Organize Your Layout
Drag and drop widgets where you want them. Resize each widget to highlight what’s important.
Step 9: Save Dashboard Changes
Click Save Changes at the top of your dashboard to lock in your setup.
Sample Use Case: Sales Manager's Dashboard
Scenario: Sarah, a Sales Manager, wants a dashboard to track her team’s performance.
She creates a new dashboard titled “Sales Overview” with the following widgets:
Bar Chart showing new opportunities created this week
Numeric Widget showing total closed deals this month
Donut Chart breaking down deal stages (Proposal Sent, Negotiation, Won)
Line Chart tracking revenue trends over the past 30 days
With filters applied to show only deals assigned to her team, Sarah now has a real-time dashboard that helps her make decisions fast—without digging into reports.
Best Practices
Keep dashboards clean and focused
Use filters to narrow results to what matters most
Regularly review and adjust widgets as your strategy evolves
Wrapping Up
Using custom widgets in Tekmatix puts essential business insights right at your fingertips. Whether you manage sales, marketing, or operations, a well-built dashboard keeps your team focused and informed.
Marketing
How To Customize Your Dashboard with Widgets in Tekmatix
How To Customize Your Dashboard with Widgets in Tekmatix
A well-organized dashboard can give your business a clear edge. Whether you need to track sales performance, lead conversions, or campaign activity, custom dashboard widgets in Tekmatix help you visualize what matters most—at a glance.
In this guide, we’ll walk you through the step-by-step process of creating and customizing widgets, including a real-world example to show how you can apply this in your business.
Why This Feature Matters
Your dashboard is your command center. Tekmatix’s dashboard widgets let you:
Track critical KPIs in real time
Visualize data with charts and tables
Build dashboards for individual users or full teams
Filter and group data for deeper insights
This makes it easier to manage performance and make decisions without having to run multiple reports.
Step-by-Step: How to Add Widgets to Your Tekmatix Dashboard
Step 1: Go to the Dashboard Tab
Log in to Tekmatix and select the Dashboard tab from the left-hand menu. This opens your default sub-account dashboard.
Step 2: (Optional) Create a New Dashboard
Want to keep things separate? Click Add Dashboard > Select a Blank Dashboard
Name it (e.g., Marketing Dashboard)
Set visibility:
Private: only you can see it
For Everyone: shared with your team
Assign permission levels (View/Edit/Full/None) to users
Click Confirm to create your new blank dashboard.
Step 3: Open the Widget Menu
Click Add Widget (or the pencil icon in the upper-right corner if editing an existing dashboard). This opens the widget selection panel.
Step 4: Choose Your Widget
Select a Chart Type:
Numeric
Donut
Line
Bar / Horizontal Bar
Table
Choose Widget Category:
Select based on what you want to track (e.g., Appointments, Opportunities, Payments).
Step 5: Customize Your Widget
Within the Widget Settings:
Add a Title and optional Description
Choose how your data should be displayed
Configure filters using Conditions
Pro Tip: Use logical groups:
AND = All conditions must be true
OR = At least one condition must be true
Note on Attribution Fields:
If you're using "Session Source" or "Session Medium":
Only 1 filter group is allowed
You must include either First Touch or Last Touch as a filter
Step 6: Save Your Widget
Once customized, click Save. Your widget will now appear on the dashboard.
Step 7: Add More Widgets
Repeat the steps to create more widgets and build a well-rounded view of your performance.
Step 8: Organize Your Layout
Drag and drop widgets where you want them. Resize each widget to highlight what’s important.
Step 9: Save Dashboard Changes
Click Save Changes at the top of your dashboard to lock in your setup.
Sample Use Case: Sales Manager's Dashboard
Scenario: Sarah, a Sales Manager, wants a dashboard to track her team’s performance.
She creates a new dashboard titled “Sales Overview” with the following widgets:
Bar Chart showing new opportunities created this week
Numeric Widget showing total closed deals this month
Donut Chart breaking down deal stages (Proposal Sent, Negotiation, Won)
Line Chart tracking revenue trends over the past 30 days
With filters applied to show only deals assigned to her team, Sarah now has a real-time dashboard that helps her make decisions fast—without digging into reports.
Best Practices
Keep dashboards clean and focused
Use filters to narrow results to what matters most
Regularly review and adjust widgets as your strategy evolves
Wrapping Up
Using custom widgets in Tekmatix puts essential business insights right at your fingertips. Whether you manage sales, marketing, or operations, a well-built dashboard keeps your team focused and informed.
How To Customize Your Dashboard with Widgets in Tekmatix
How To Customize Your Dashboard with Widgets in Tekmatix
A well-organized dashboard can give your business a clear edge. Whether you need to track sales performance, lead conversions, or campaign activity, custom dashboard widgets in Tekmatix help you visualize what matters most—at a glance.
In this guide, we’ll walk you through the step-by-step process of creating and customizing widgets, including a real-world example to show how you can apply this in your business.
Why This Feature Matters
Your dashboard is your command center. Tekmatix’s dashboard widgets let you:
Track critical KPIs in real time
Visualize data with charts and tables
Build dashboards for individual users or full teams
Filter and group data for deeper insights
This makes it easier to manage performance and make decisions without having to run multiple reports.
Step-by-Step: How to Add Widgets to Your Tekmatix Dashboard
Step 1: Go to the Dashboard Tab
Log in to Tekmatix and select the Dashboard tab from the left-hand menu. This opens your default sub-account dashboard.
Step 2: (Optional) Create a New Dashboard
Want to keep things separate? Click Add Dashboard > Select a Blank Dashboard
Name it (e.g., Marketing Dashboard)
Set visibility:
Private: only you can see it
For Everyone: shared with your team
Assign permission levels (View/Edit/Full/None) to users
Click Confirm to create your new blank dashboard.
Step 3: Open the Widget Menu
Click Add Widget (or the pencil icon in the upper-right corner if editing an existing dashboard). This opens the widget selection panel.
Step 4: Choose Your Widget
Select a Chart Type:
Numeric
Donut
Line
Bar / Horizontal Bar
Table
Choose Widget Category:
Select based on what you want to track (e.g., Appointments, Opportunities, Payments).
Step 5: Customize Your Widget
Within the Widget Settings:
Add a Title and optional Description
Choose how your data should be displayed
Configure filters using Conditions
Pro Tip: Use logical groups:
AND = All conditions must be true
OR = At least one condition must be true
Note on Attribution Fields:
If you're using "Session Source" or "Session Medium":
Only 1 filter group is allowed
You must include either First Touch or Last Touch as a filter
Step 6: Save Your Widget
Once customized, click Save. Your widget will now appear on the dashboard.
Step 7: Add More Widgets
Repeat the steps to create more widgets and build a well-rounded view of your performance.
Step 8: Organize Your Layout
Drag and drop widgets where you want them. Resize each widget to highlight what’s important.
Step 9: Save Dashboard Changes
Click Save Changes at the top of your dashboard to lock in your setup.
Sample Use Case: Sales Manager's Dashboard
Scenario: Sarah, a Sales Manager, wants a dashboard to track her team’s performance.
She creates a new dashboard titled “Sales Overview” with the following widgets:
Bar Chart showing new opportunities created this week
Numeric Widget showing total closed deals this month
Donut Chart breaking down deal stages (Proposal Sent, Negotiation, Won)
Line Chart tracking revenue trends over the past 30 days
With filters applied to show only deals assigned to her team, Sarah now has a real-time dashboard that helps her make decisions fast—without digging into reports.
Best Practices
Keep dashboards clean and focused
Use filters to narrow results to what matters most
Regularly review and adjust widgets as your strategy evolves
Wrapping Up
Using custom widgets in Tekmatix puts essential business insights right at your fingertips. Whether you manage sales, marketing, or operations, a well-built dashboard keeps your team focused and informed.
CRM
How To Customize Your Dashboard with Widgets in Tekmatix
How To Customize Your Dashboard with Widgets in Tekmatix
A well-organized dashboard can give your business a clear edge. Whether you need to track sales performance, lead conversions, or campaign activity, custom dashboard widgets in Tekmatix help you visualize what matters most—at a glance.
In this guide, we’ll walk you through the step-by-step process of creating and customizing widgets, including a real-world example to show how you can apply this in your business.
Why This Feature Matters
Your dashboard is your command center. Tekmatix’s dashboard widgets let you:
Track critical KPIs in real time
Visualize data with charts and tables
Build dashboards for individual users or full teams
Filter and group data for deeper insights
This makes it easier to manage performance and make decisions without having to run multiple reports.
Step-by-Step: How to Add Widgets to Your Tekmatix Dashboard
Step 1: Go to the Dashboard Tab
Log in to Tekmatix and select the Dashboard tab from the left-hand menu. This opens your default sub-account dashboard.
Step 2: (Optional) Create a New Dashboard
Want to keep things separate? Click Add Dashboard > Select a Blank Dashboard
Name it (e.g., Marketing Dashboard)
Set visibility:
Private: only you can see it
For Everyone: shared with your team
Assign permission levels (View/Edit/Full/None) to users
Click Confirm to create your new blank dashboard.
Step 3: Open the Widget Menu
Click Add Widget (or the pencil icon in the upper-right corner if editing an existing dashboard). This opens the widget selection panel.
Step 4: Choose Your Widget
Select a Chart Type:
Numeric
Donut
Line
Bar / Horizontal Bar
Table
Choose Widget Category:
Select based on what you want to track (e.g., Appointments, Opportunities, Payments).
Step 5: Customize Your Widget
Within the Widget Settings:
Add a Title and optional Description
Choose how your data should be displayed
Configure filters using Conditions
Pro Tip: Use logical groups:
AND = All conditions must be true
OR = At least one condition must be true
Note on Attribution Fields:
If you're using "Session Source" or "Session Medium":
Only 1 filter group is allowed
You must include either First Touch or Last Touch as a filter
Step 6: Save Your Widget
Once customized, click Save. Your widget will now appear on the dashboard.
Step 7: Add More Widgets
Repeat the steps to create more widgets and build a well-rounded view of your performance.
Step 8: Organize Your Layout
Drag and drop widgets where you want them. Resize each widget to highlight what’s important.
Step 9: Save Dashboard Changes
Click Save Changes at the top of your dashboard to lock in your setup.
Sample Use Case: Sales Manager's Dashboard
Scenario: Sarah, a Sales Manager, wants a dashboard to track her team’s performance.
She creates a new dashboard titled “Sales Overview” with the following widgets:
Bar Chart showing new opportunities created this week
Numeric Widget showing total closed deals this month
Donut Chart breaking down deal stages (Proposal Sent, Negotiation, Won)
Line Chart tracking revenue trends over the past 30 days
With filters applied to show only deals assigned to her team, Sarah now has a real-time dashboard that helps her make decisions fast—without digging into reports.
Best Practices
Keep dashboards clean and focused
Use filters to narrow results to what matters most
Regularly review and adjust widgets as your strategy evolves
Wrapping Up
Using custom widgets in Tekmatix puts essential business insights right at your fingertips. Whether you manage sales, marketing, or operations, a well-built dashboard keeps your team focused and informed.
How To Customize Your Dashboard with Widgets in Tekmatix
How To Customize Your Dashboard with Widgets in Tekmatix
A well-organized dashboard can give your business a clear edge. Whether you need to track sales performance, lead conversions, or campaign activity, custom dashboard widgets in Tekmatix help you visualize what matters most—at a glance.
In this guide, we’ll walk you through the step-by-step process of creating and customizing widgets, including a real-world example to show how you can apply this in your business.
Why This Feature Matters
Your dashboard is your command center. Tekmatix’s dashboard widgets let you:
Track critical KPIs in real time
Visualize data with charts and tables
Build dashboards for individual users or full teams
Filter and group data for deeper insights
This makes it easier to manage performance and make decisions without having to run multiple reports.
Step-by-Step: How to Add Widgets to Your Tekmatix Dashboard
Step 1: Go to the Dashboard Tab
Log in to Tekmatix and select the Dashboard tab from the left-hand menu. This opens your default sub-account dashboard.
Step 2: (Optional) Create a New Dashboard
Want to keep things separate? Click Add Dashboard > Select a Blank Dashboard
Name it (e.g., Marketing Dashboard)
Set visibility:
Private: only you can see it
For Everyone: shared with your team
Assign permission levels (View/Edit/Full/None) to users
Click Confirm to create your new blank dashboard.
Step 3: Open the Widget Menu
Click Add Widget (or the pencil icon in the upper-right corner if editing an existing dashboard). This opens the widget selection panel.
Step 4: Choose Your Widget
Select a Chart Type:
Numeric
Donut
Line
Bar / Horizontal Bar
Table
Choose Widget Category:
Select based on what you want to track (e.g., Appointments, Opportunities, Payments).
Step 5: Customize Your Widget
Within the Widget Settings:
Add a Title and optional Description
Choose how your data should be displayed
Configure filters using Conditions
Pro Tip: Use logical groups:
AND = All conditions must be true
OR = At least one condition must be true
Note on Attribution Fields:
If you're using "Session Source" or "Session Medium":
Only 1 filter group is allowed
You must include either First Touch or Last Touch as a filter
Step 6: Save Your Widget
Once customized, click Save. Your widget will now appear on the dashboard.
Step 7: Add More Widgets
Repeat the steps to create more widgets and build a well-rounded view of your performance.
Step 8: Organize Your Layout
Drag and drop widgets where you want them. Resize each widget to highlight what’s important.
Step 9: Save Dashboard Changes
Click Save Changes at the top of your dashboard to lock in your setup.
Sample Use Case: Sales Manager's Dashboard
Scenario: Sarah, a Sales Manager, wants a dashboard to track her team’s performance.
She creates a new dashboard titled “Sales Overview” with the following widgets:
Bar Chart showing new opportunities created this week
Numeric Widget showing total closed deals this month
Donut Chart breaking down deal stages (Proposal Sent, Negotiation, Won)
Line Chart tracking revenue trends over the past 30 days
With filters applied to show only deals assigned to her team, Sarah now has a real-time dashboard that helps her make decisions fast—without digging into reports.
Best Practices
Keep dashboards clean and focused
Use filters to narrow results to what matters most
Regularly review and adjust widgets as your strategy evolves
Wrapping Up
Using custom widgets in Tekmatix puts essential business insights right at your fingertips. Whether you manage sales, marketing, or operations, a well-built dashboard keeps your team focused and informed.

Join The TekMatix Newsletter
Get sent regular tech and business growth tips.
Web Design
How To Customize Your Dashboard with Widgets in Tekmatix
How To Customize Your Dashboard with Widgets in Tekmatix
A well-organized dashboard can give your business a clear edge. Whether you need to track sales performance, lead conversions, or campaign activity, custom dashboard widgets in Tekmatix help you visualize what matters most—at a glance.
In this guide, we’ll walk you through the step-by-step process of creating and customizing widgets, including a real-world example to show how you can apply this in your business.
Why This Feature Matters
Your dashboard is your command center. Tekmatix’s dashboard widgets let you:
Track critical KPIs in real time
Visualize data with charts and tables
Build dashboards for individual users or full teams
Filter and group data for deeper insights
This makes it easier to manage performance and make decisions without having to run multiple reports.
Step-by-Step: How to Add Widgets to Your Tekmatix Dashboard
Step 1: Go to the Dashboard Tab
Log in to Tekmatix and select the Dashboard tab from the left-hand menu. This opens your default sub-account dashboard.
Step 2: (Optional) Create a New Dashboard
Want to keep things separate? Click Add Dashboard > Select a Blank Dashboard
Name it (e.g., Marketing Dashboard)
Set visibility:
Private: only you can see it
For Everyone: shared with your team
Assign permission levels (View/Edit/Full/None) to users
Click Confirm to create your new blank dashboard.
Step 3: Open the Widget Menu
Click Add Widget (or the pencil icon in the upper-right corner if editing an existing dashboard). This opens the widget selection panel.
Step 4: Choose Your Widget
Select a Chart Type:
Numeric
Donut
Line
Bar / Horizontal Bar
Table
Choose Widget Category:
Select based on what you want to track (e.g., Appointments, Opportunities, Payments).
Step 5: Customize Your Widget
Within the Widget Settings:
Add a Title and optional Description
Choose how your data should be displayed
Configure filters using Conditions
Pro Tip: Use logical groups:
AND = All conditions must be true
OR = At least one condition must be true
Note on Attribution Fields:
If you're using "Session Source" or "Session Medium":
Only 1 filter group is allowed
You must include either First Touch or Last Touch as a filter
Step 6: Save Your Widget
Once customized, click Save. Your widget will now appear on the dashboard.
Step 7: Add More Widgets
Repeat the steps to create more widgets and build a well-rounded view of your performance.
Step 8: Organize Your Layout
Drag and drop widgets where you want them. Resize each widget to highlight what’s important.
Step 9: Save Dashboard Changes
Click Save Changes at the top of your dashboard to lock in your setup.
Sample Use Case: Sales Manager's Dashboard
Scenario: Sarah, a Sales Manager, wants a dashboard to track her team’s performance.
She creates a new dashboard titled “Sales Overview” with the following widgets:
Bar Chart showing new opportunities created this week
Numeric Widget showing total closed deals this month
Donut Chart breaking down deal stages (Proposal Sent, Negotiation, Won)
Line Chart tracking revenue trends over the past 30 days
With filters applied to show only deals assigned to her team, Sarah now has a real-time dashboard that helps her make decisions fast—without digging into reports.
Best Practices
Keep dashboards clean and focused
Use filters to narrow results to what matters most
Regularly review and adjust widgets as your strategy evolves
Wrapping Up
Using custom widgets in Tekmatix puts essential business insights right at your fingertips. Whether you manage sales, marketing, or operations, a well-built dashboard keeps your team focused and informed.
How To Customize Your Dashboard with Widgets in Tekmatix
How To Customize Your Dashboard with Widgets in Tekmatix
A well-organized dashboard can give your business a clear edge. Whether you need to track sales performance, lead conversions, or campaign activity, custom dashboard widgets in Tekmatix help you visualize what matters most—at a glance.
In this guide, we’ll walk you through the step-by-step process of creating and customizing widgets, including a real-world example to show how you can apply this in your business.
Why This Feature Matters
Your dashboard is your command center. Tekmatix’s dashboard widgets let you:
Track critical KPIs in real time
Visualize data with charts and tables
Build dashboards for individual users or full teams
Filter and group data for deeper insights
This makes it easier to manage performance and make decisions without having to run multiple reports.
Step-by-Step: How to Add Widgets to Your Tekmatix Dashboard
Step 1: Go to the Dashboard Tab
Log in to Tekmatix and select the Dashboard tab from the left-hand menu. This opens your default sub-account dashboard.
Step 2: (Optional) Create a New Dashboard
Want to keep things separate? Click Add Dashboard > Select a Blank Dashboard
Name it (e.g., Marketing Dashboard)
Set visibility:
Private: only you can see it
For Everyone: shared with your team
Assign permission levels (View/Edit/Full/None) to users
Click Confirm to create your new blank dashboard.
Step 3: Open the Widget Menu
Click Add Widget (or the pencil icon in the upper-right corner if editing an existing dashboard). This opens the widget selection panel.
Step 4: Choose Your Widget
Select a Chart Type:
Numeric
Donut
Line
Bar / Horizontal Bar
Table
Choose Widget Category:
Select based on what you want to track (e.g., Appointments, Opportunities, Payments).
Step 5: Customize Your Widget
Within the Widget Settings:
Add a Title and optional Description
Choose how your data should be displayed
Configure filters using Conditions
Pro Tip: Use logical groups:
AND = All conditions must be true
OR = At least one condition must be true
Note on Attribution Fields:
If you're using "Session Source" or "Session Medium":
Only 1 filter group is allowed
You must include either First Touch or Last Touch as a filter
Step 6: Save Your Widget
Once customized, click Save. Your widget will now appear on the dashboard.
Step 7: Add More Widgets
Repeat the steps to create more widgets and build a well-rounded view of your performance.
Step 8: Organize Your Layout
Drag and drop widgets where you want them. Resize each widget to highlight what’s important.
Step 9: Save Dashboard Changes
Click Save Changes at the top of your dashboard to lock in your setup.
Sample Use Case: Sales Manager's Dashboard
Scenario: Sarah, a Sales Manager, wants a dashboard to track her team’s performance.
She creates a new dashboard titled “Sales Overview” with the following widgets:
Bar Chart showing new opportunities created this week
Numeric Widget showing total closed deals this month
Donut Chart breaking down deal stages (Proposal Sent, Negotiation, Won)
Line Chart tracking revenue trends over the past 30 days
With filters applied to show only deals assigned to her team, Sarah now has a real-time dashboard that helps her make decisions fast—without digging into reports.
Best Practices
Keep dashboards clean and focused
Use filters to narrow results to what matters most
Regularly review and adjust widgets as your strategy evolves
Wrapping Up
Using custom widgets in Tekmatix puts essential business insights right at your fingertips. Whether you manage sales, marketing, or operations, a well-built dashboard keeps your team focused and informed.